The Level CI Usage Dashboard gives your organization clear visibility into build consumption and contract periods. It helps teams understand usage trends, stay within limits, and plan scans effectively, reducing uncertainty and preventing unexpected scan failures.
On this page:
Get started
To get started with the usage dashboard:
- Go to the Usage Tab in the Level CI Organization view.
- Ensure onboarding data is entered by your onboarding agent.
- You can start monitoring usage at the organization and project levels immediately.
Key benefits
- Track usage and limits: See total builds used versus your contractual limit.
- Monitor projects: Understand activity at the project level and identify high-usage areas.
- Stay informed: View current and past renewal periods to plan ahead.
- Prevent surprises: Automatic refresh ensures up-to-date information every ≤ 5 minutes.
- All team visibility: Everyone in the organization can access the dashboard for transparency.
Dashboard features
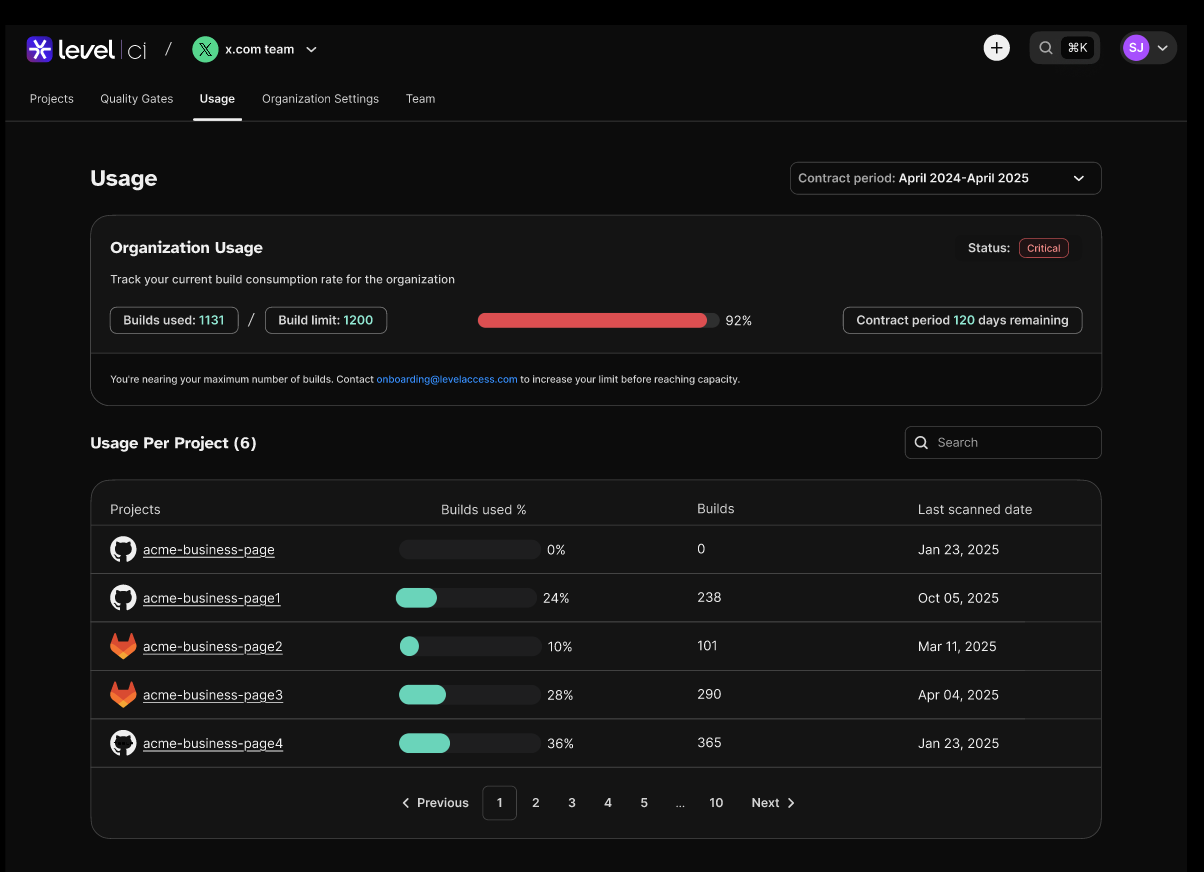
Organization-level overview
The Organization usage card displays:
- Builds Used – Total builds executed in the current period.
- Build Limit – Your organization’s contractual build allowance.
- Usage Percentage – A visual progress bar showing usage against limit.
- Contract Period Remaining – Days remaining until your contract expires.
- Onboarding Contact – Email of your onboarding agent for questions.
- Visual Status: Progress bar and labels update dynamically based on usage or contract status.
Project-level usage
You can view per-project consumption details in the project-level usage table:
- Project name: Click to view project details if scans exist.
- Builds used (%) and absolute: Track project-level scan usage.
- Last scanned date: Know when a project was last active.
Additional features
- You can sort by usage percentage.
- Projects can be searched by name.
- Paginated view (5 projects per page)
- Clear empty state message when no projects exist, with guidance to get started.
- Usage status.
The dashboard uses a progress-based visual system with colors and icons to indicate build usage status and understand different statuses:
| Status | Progress | What needs to be done |
|---|---|---|
| Active | ≤79% | No concerns on the build limit. |
| Warning | ≥80% | Build usage may exceed limit within the contract period; a top-up may be needed. |
| Critical | ≥90% | Major concern; you may exceed the build limit very soon and need to take action. |
| Limit Reached | 100% | Build limit reached; no new builds can run unless topped up. |
Alerts and warnings
The UI displays a warning for build consumptions.
The interface lets you know when you reach a critical limit for build consumption,.
Renewal Periods
- Default view shows the current renewal cycle.
- The dropdown allows viewing usage from the past three renewal periods.
- There is no overlapping data between periods.
Comments
0 comments
Article is closed for comments.